Warning
This content has been generated by machine translation. The translations are automated and have not undergone human review or validation.
5.2.2.2 Send OKE logs by FluentD
Use OpenSearch and OpenSearch Dashboard instead of ElasticSearch and Kibana in your EFK configuration.
Fluentd configuration
Create a Service Account for Fluentd installation and define the relevant permissions.
configmap to define additional settings
- Fluentd-related settings are all defined in a .conf file under /fluentd/etc/ in the container. You can override these files.
- OCI OpenSearch clusters now use Self Signed certificates by default. Leave only the basics that are absolutely necessary for the connection. If you leave the commented out part and don’t set a value, you will get an error at run time.
Define a fluentd damonset
- Some changes have been made to the YAML in the Fluentd documentation to use the configured configmap.
- We are changing to use fluent.conf overridden by configmap.
- You are setting up the Self Signed CA used by the OpenSearch Dashboard.
Install FluentD
In fluentd-daemonset-opensearch.yaml, change FLUENT_OPENSEARCH_HOST to the target OpenSearch host.
...
        env:
          - name:  FLUENT_OPENSEARCH_HOST
            value: "amaaaaaavsea7yia3enl6q6yrwekrd7qpi3yqaphhcvwowtmzftkt45jel7a.opendashboard.ap-chuncheon-1.oci.oraclecloud.com"
          - name:  FLUENT_OPENSEARCH_PORT
            value: "9200"
          ...
Install FluentD
kubectl apply -f fluentd-rbac.yaml
kubectl apply -f fluentd-configmap-opensearch.yaml
kubectl apply -f fluentd-daemonset-opensearch.yaml
Add a security rule to send logs from OKE cluster Worker Node to OpenSearch.
Worker Node security rules
Target: ex) oke-nodeseclist-quick-oke-cluster-1-04cdcc334
Egress Rules:
The example below is when the OpenSearch location is subnet 10.0.20.0/24.
Stateless Destination IP Protocol Source Port Range Destination Port Range Description No 10.0.20.0/24 TCP All 9200 OpenSearch API
Security rules of OpenSearch
Target: ex) oke-svclbseclist-quick-oke-cluster-1-04cdcc334
Ingress Rules:
In the example below, if the Worker Node is in the subnet 10.0.10.0/24,
Stateless Source IP Protocol Source Port Range Destination Port Range Description No 10.0.10.0/24 TCP All 9200 OpenSearch API
Check the log
When the fluentd Pod starts up, check the logs to see if it operates normally without any connection errors with OpenSearch.
$ kubectl get pod -n kube-system
NAME                                   READY   STATUS    RESTARTS      AGE
...
fluentd-7hbht                          1/1     Running   0             99s
fluentd-qwrg4                          1/1     Running   0             99s
fluentd-zfgfz                          1/1     Running   0             99s
...
$ kubectl logs -f fluentd-7hbht -n kube-system -f
2022-10-13 15:31:30 +0000 [info]: parsing config file is succeeded path="/fluentd/etc/fluent.conf"
...
2022-10-13 15:31:32 +0000 [info]: adding match pattern="**" type="opensearch"
...
2022-10-13 15:31:32 +0000 [info]: #0 starting fluentd worker pid=14 ppid=6 worker=0
2022-10-13 15:31:32 +0000 [info]: #0 [in_tail_container_logs] following tail of /var/log/containers/proxymux-client-s75ds_kube-system_proxymux-client-eca8e5e37a2dbf317be4f25cddcce1f4659c5bf9adecccdf522f1f2317b17dc3.log
2022-10-13 15:31:32 +0000 [info]: #0 [in_tail_container_logs] following tail of /var/log/containers/csi-oci-node-vlgnm_kube-system_csi-node-driver-d566fd830f5a575b4d3724946f4a09a23bdf7615527b511a42cbae57c27bab0d.log
OpenSearch Dashboard Settings
If you have not connected to the jumpbox VM through SSH tunneling, reconnect.
Since SSH tunneling is done, check the connection to the OpenSearch Dashboard with a browser locally.
- Access address: https://localhost:5601
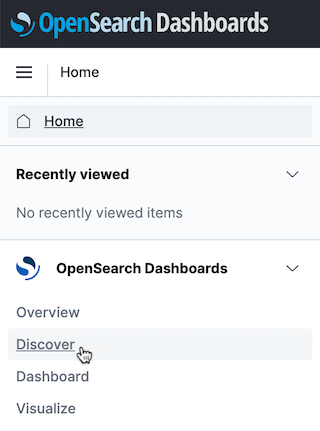
In the upper left navigation menu, click OpenSearch Dashboards > Discover.
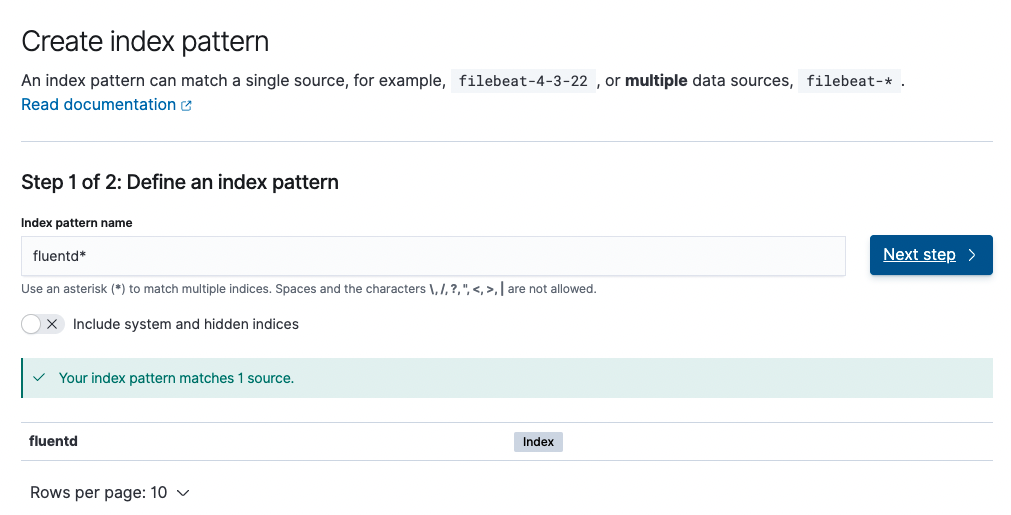
Click Create index pattern.
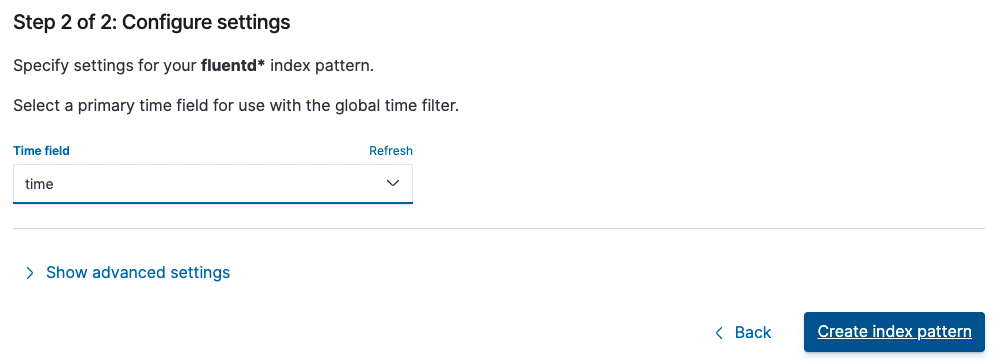
Create an index pattern.
Among the three sources shown below, we use the fluentd source.
- Index pattern name: fluentd
- Time field: time
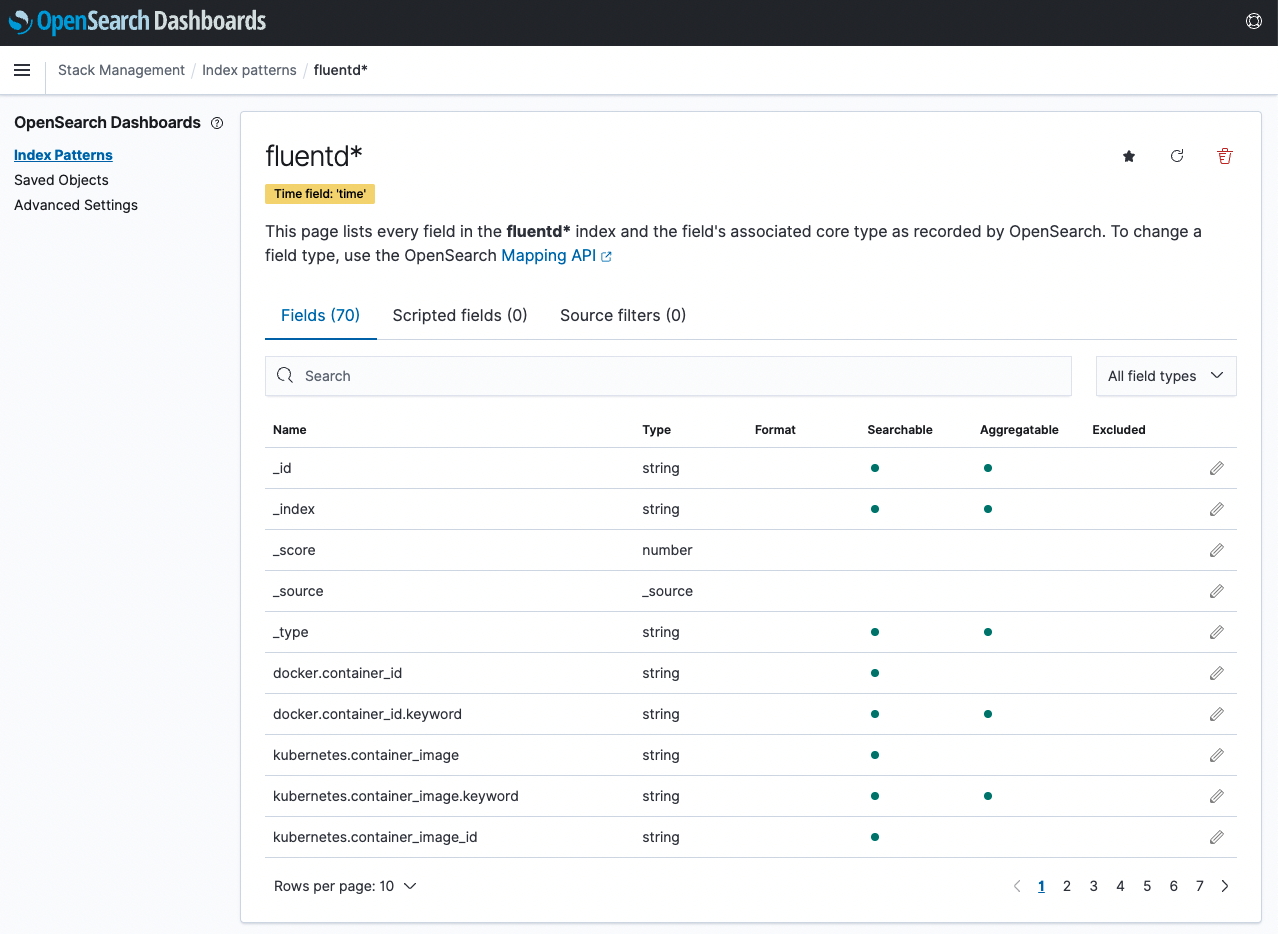
You can see the result of adding the index pattern.
Click OpenSearch Dashboards > Discover in the upper left navigation menu.
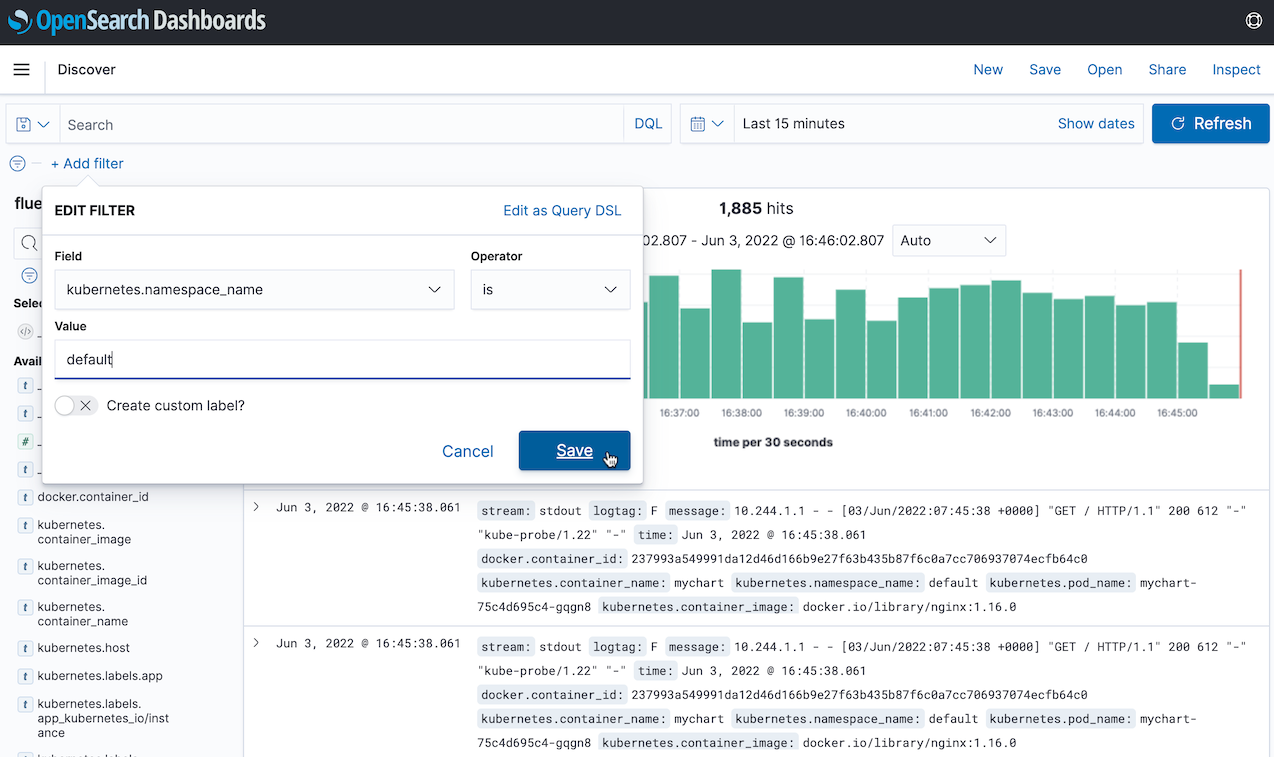
You can check the collected logs through the created index pattern.
- To check the log of the test app, click Add filter to specify namespace_name=default .
Access the test app.
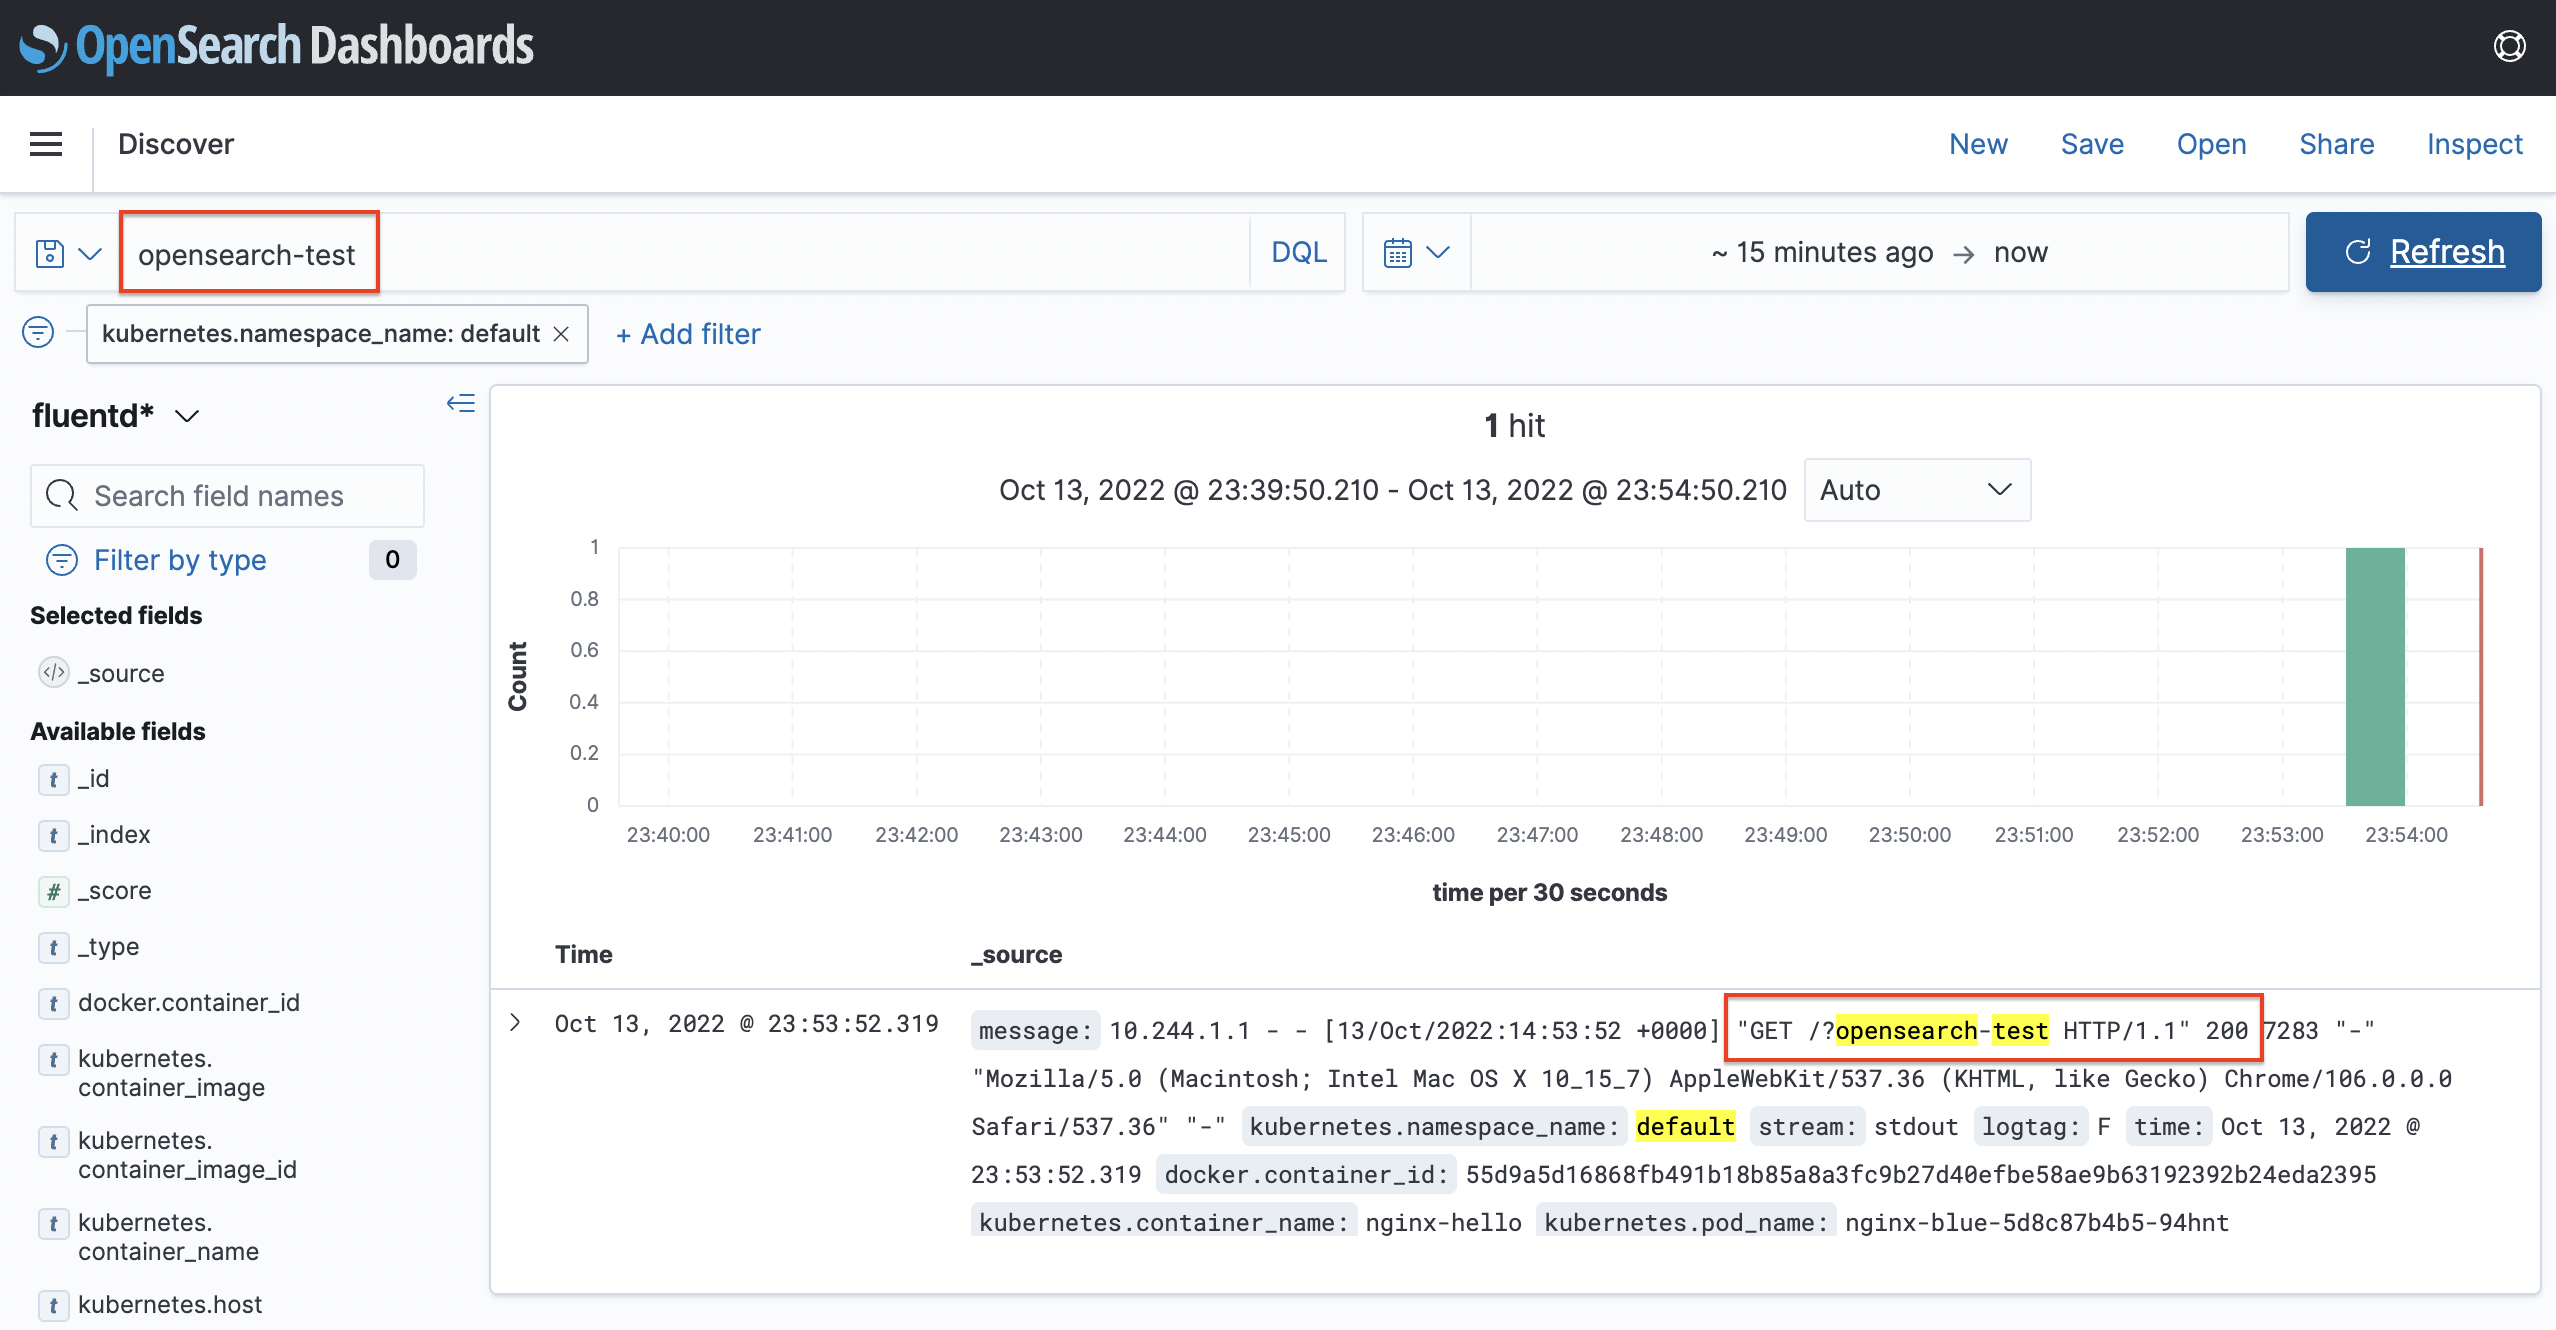
Check the log
You can check the log of the test app in the OpenSearch Dashboard as shown below.
As an individual, this article was written with my personal time. There may be errors in the content of the article, and the opinions in the article are personal opinions.