Warning
This content has been generated by machine translation. The translations are automated and have not undergone human review or validation.
12.3.2 Grafana Configuration
Register Data Source
-
Log in to Grafana.
-
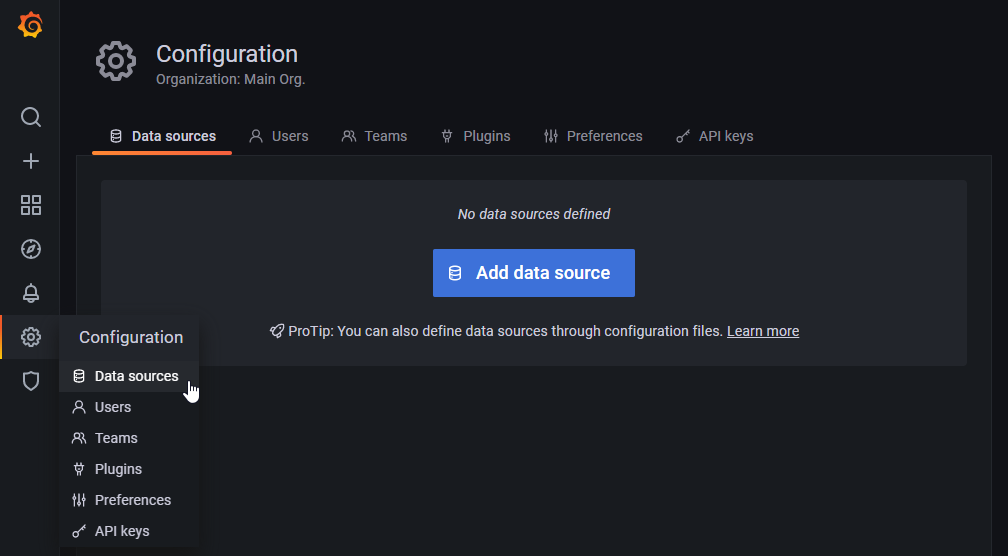
Go to left menu Configuration > Data Sources, or click Add data source on the home dashboard.
-
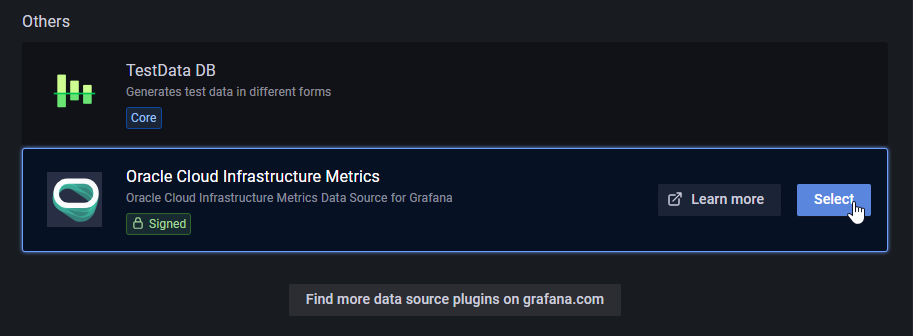
Select Oracle Cloud Infrastructure among data sources
-
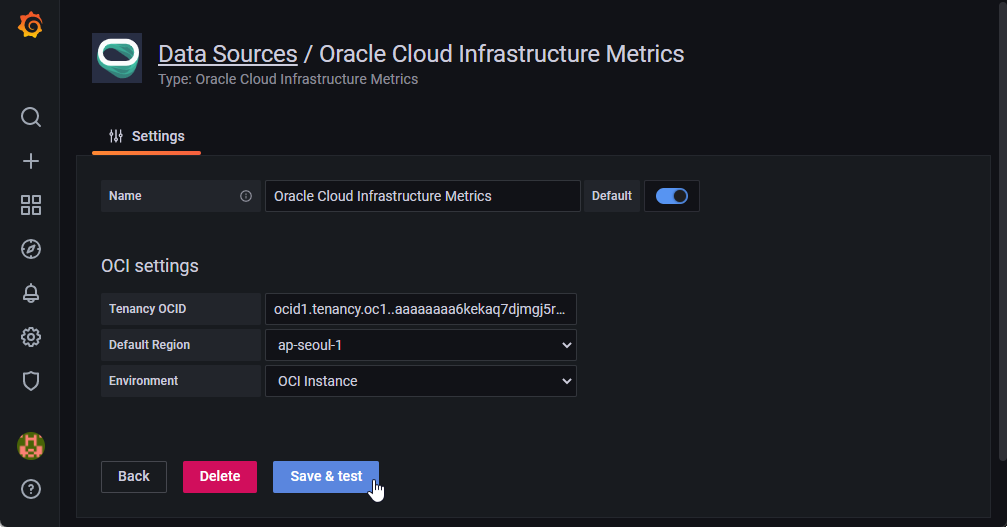
OCI Data Source Settings
- Tenancy OCID: Log in to the OCI Console, check and enter the Tenancy OCID
- Default Region: Select the desired Region
- Environment: Select OCI Instance
-
Click Save & Test to check if the connection is successful.
Create Dashboard
-
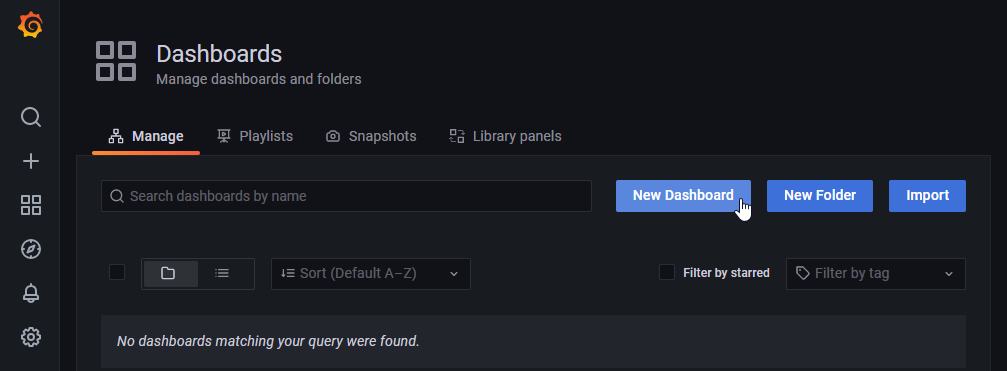
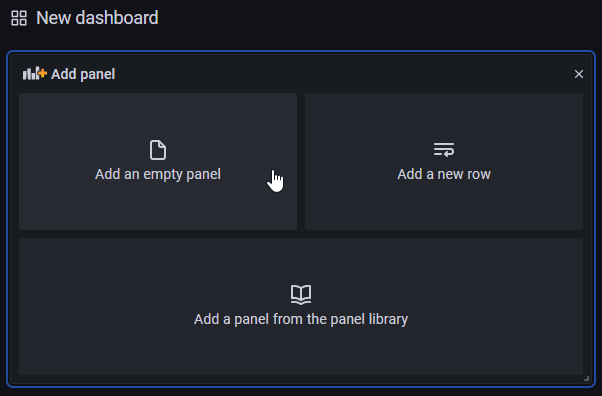
Go to the left menu Dashboard > Manage, or click New Dashboard on your home dashboard.
-
Select the blank panel.
-
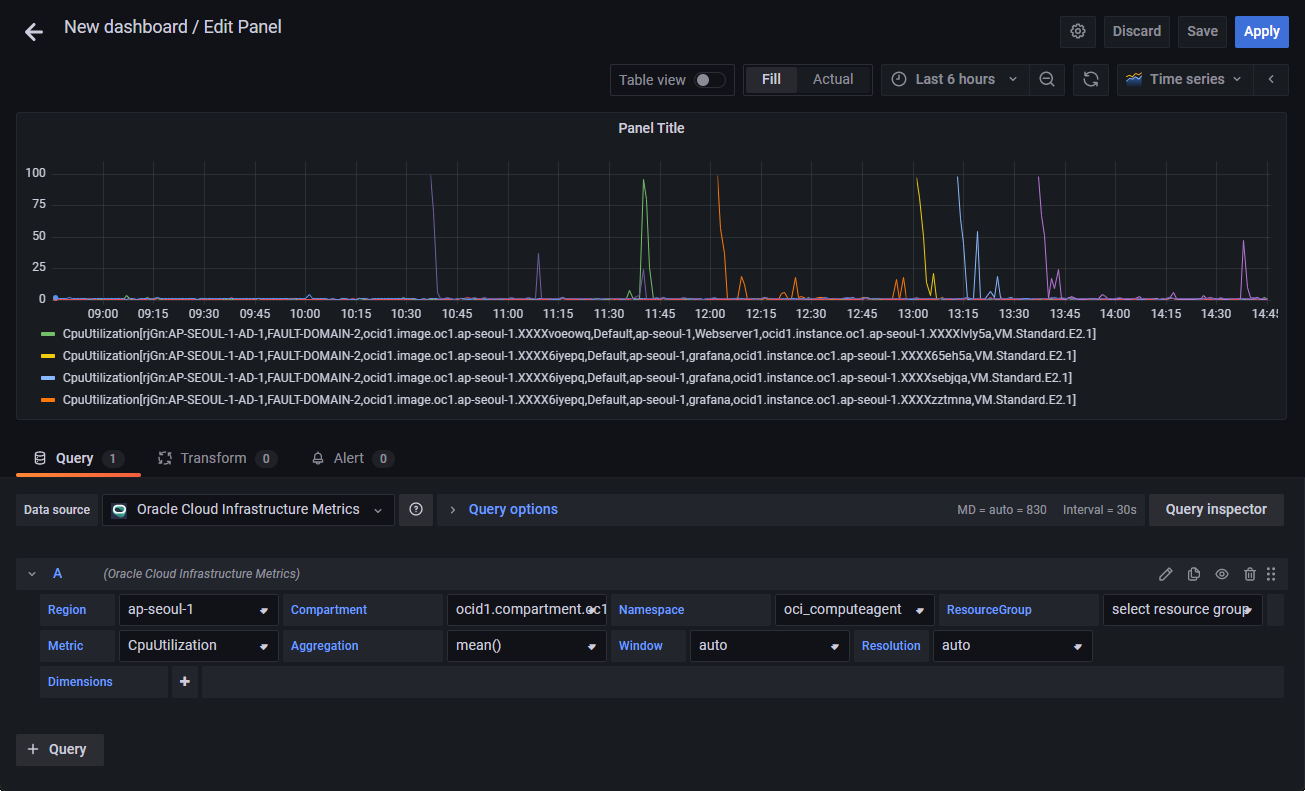
Click the Query icon at the top of the left menu.
-
In the Query item, select the Oracle Cloud Infrastructure Metrics that you added the data source to, and set them one by one in order from Region to Metric.
-
Save the graph you created.
Using the template function
-
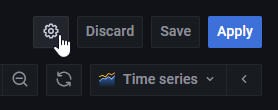
Click the Dashboard Settings icon in the upper right corner.
-
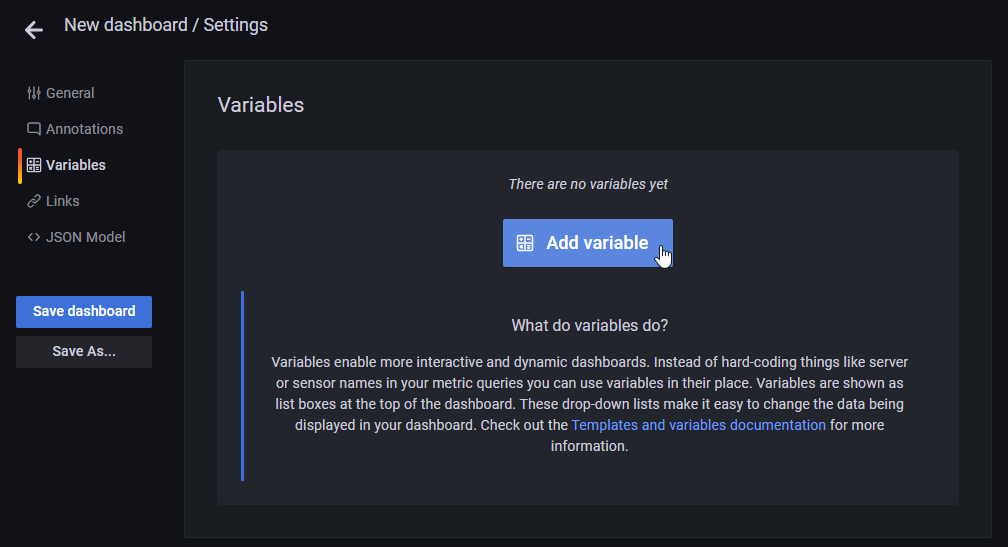
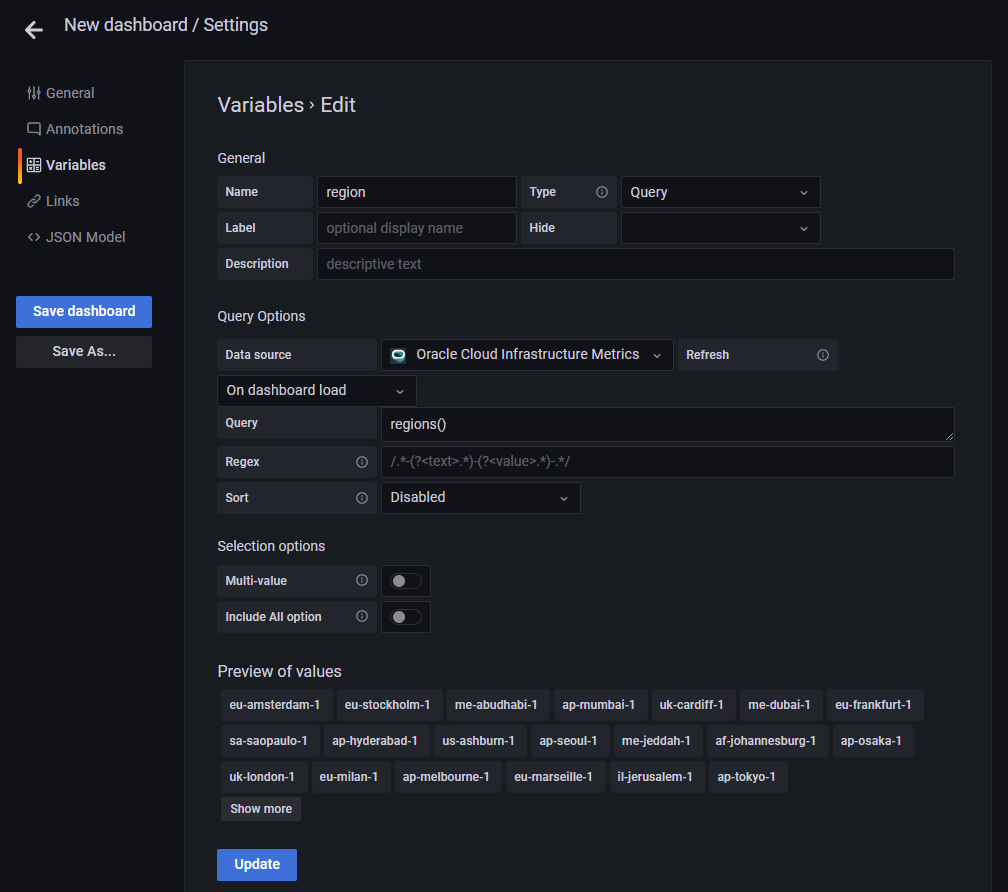
To add a variable, select Variables on the left and click Add variable
-
Add a new variable. As seen in Preview of values, query results can be viewed as variables and used in the dashboard.
- Name: region
- Query: regions()
-
Add the 2 variables below.
Name Query region regions() compartment compartments() -
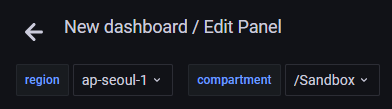
Go back to the dashboard and you will see the variable added as an option at the top.
-
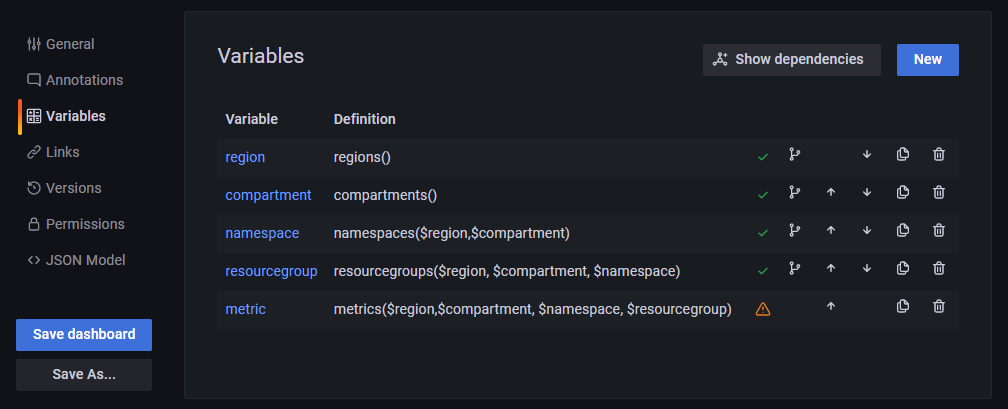
Select the actual viewable regions and compartments. And add the following variable in Dashboard Setting. If region and compartment are not selected, the following variables are related variables. When adding variables, an error may occur during the initial inquiry.
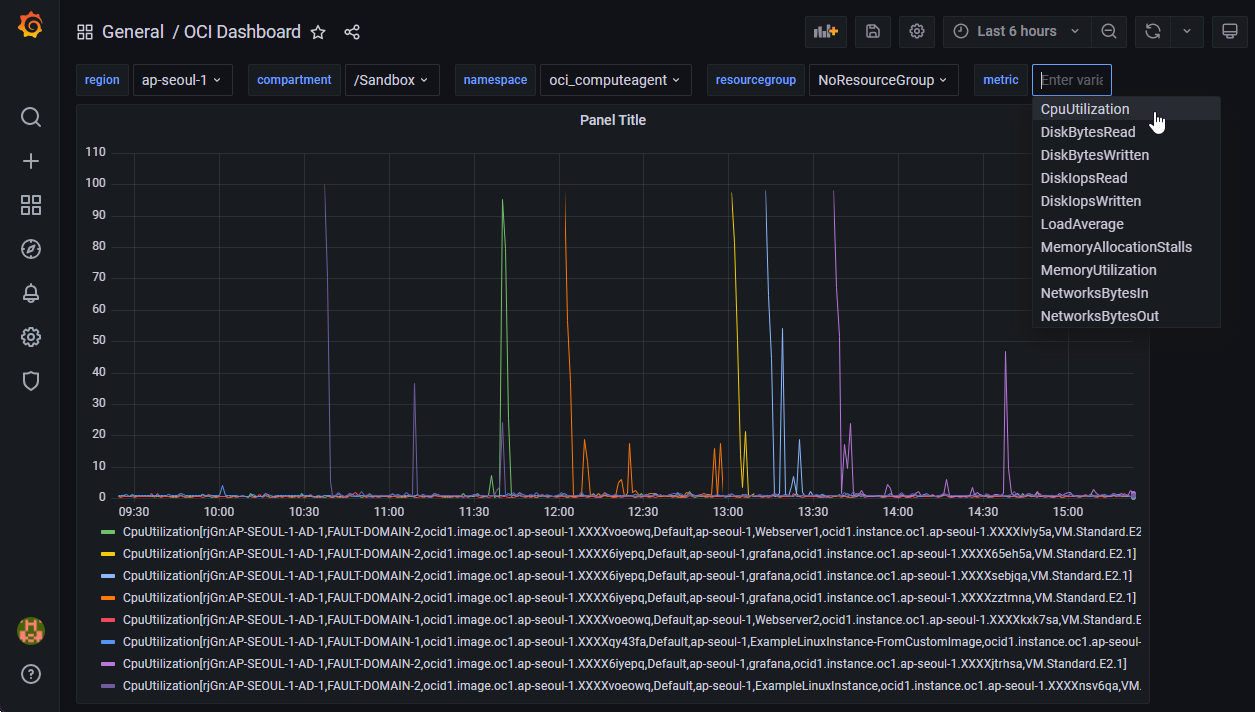
Name Query namespace namespaces($region,$compartment) resourcegroup resourcegroups($region, $compartment, $namespace) metric metrics($region,$compartment, $namespace, $resourcegroup) -
Finish adding variables
-
Save the dashboard.
-
Go back to the graph you created earlier. Edit the first added panel again.
-
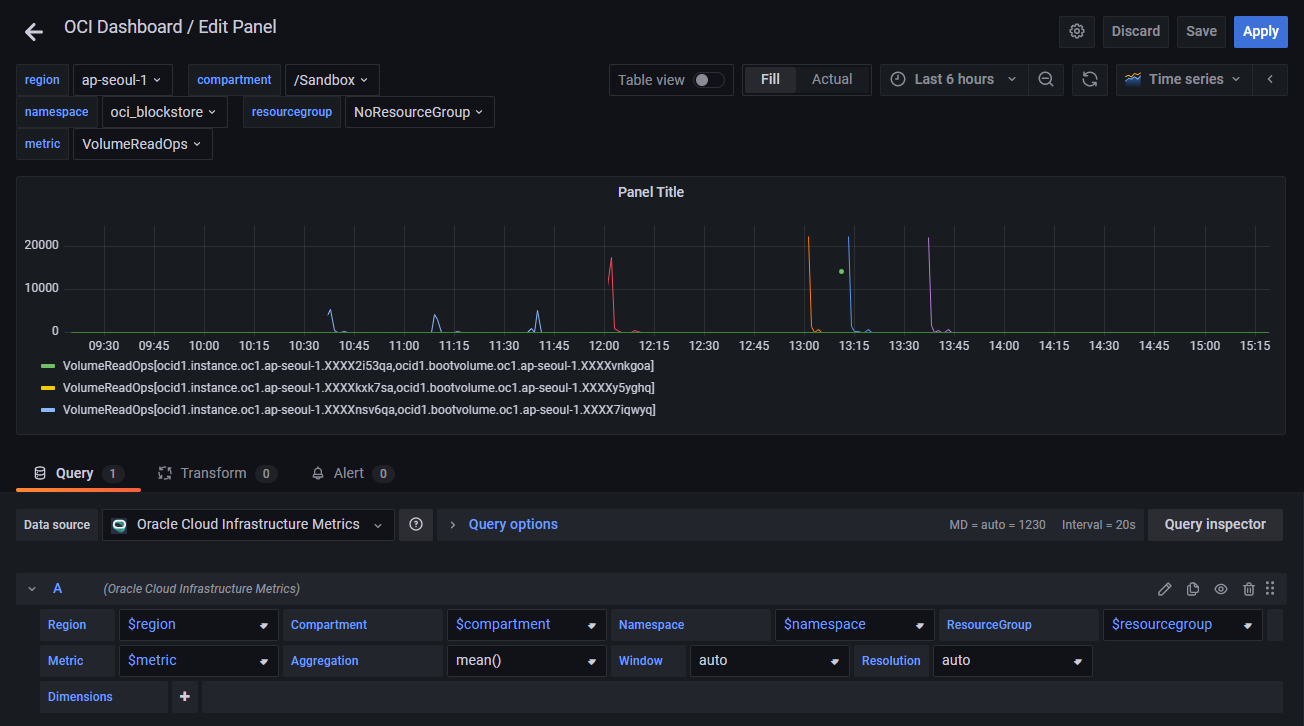
Change the variable you created earlier as the parameter of the lower query. For example, Region: $region. Then, if you select a value from the drop-down list at the top of the dashboard, the variable value is changed and displayed in the desired graph. In the drop-down list, if there is no monitored data, the list may not be visible, so please do not misunderstand.
-
Click Apply in the upper right corner to save the dashboard.
-
Move from the edit screen to the dashboard screen.
-
You can search the dashboard as shown in the picture.
Reference site
- https://grafana.com/blog/2019/02/25/oracle-cloud-infrastructure-as-a-data-source-for-grafana/
- https://blogs.oracle.com/cloudnative/data-source-grafana
- oci-grafana-metrics/using.md at master · oracle/oci-grafana-metrics (github.com)
As an individual, this article was written with my personal time. There may be errors in the content of the article, and the opinions in the article are personal opinions.