Warning
This content has been generated by machine translation. The translations are automated and have not undergone human review or validation.
12.3.1 Install Grafana on Compute VM
Create Compute Instance
-
Go to the Compute Instance creation screen.
-
Select the image source as the Oracle Linux Cloud Developer Image image from the Oracle Images list.
Oracle Cloud Developer Image has development tools such as OCI CLI already installed.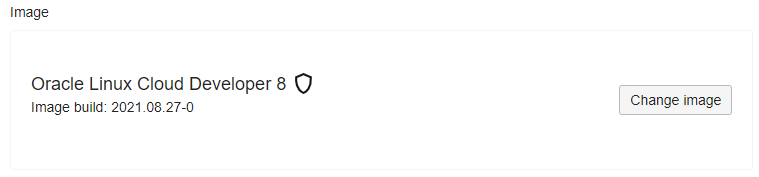
-
Create a Compute instance.
-
Copy the OCID of the created Compute instance.
OCI CLI - Instance Principal Settings
In order to use the OCI API without additional authentication on the Compute instance, you need to set the Instance Principal. The procedure is to add a Compute instance to a Dynamic Group and grant permissions to that Group.
Dynamic Group Settings
-
Open the navigation menu in the OCI console. Go to Identity & Security > Identity > Dynamic Groups.
-
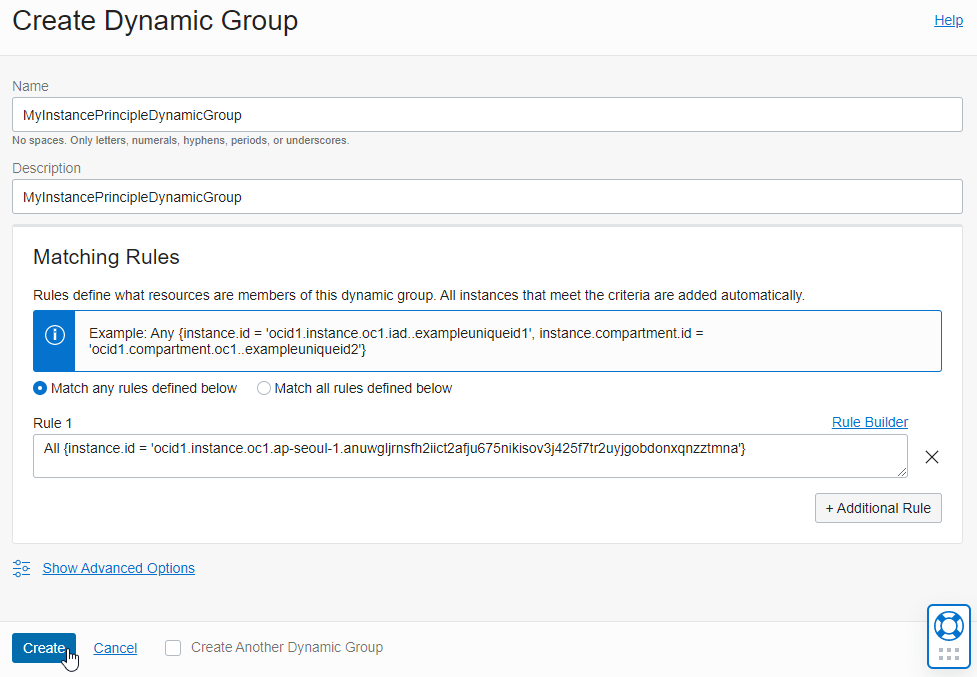
Click Create Dynamic Group.
-
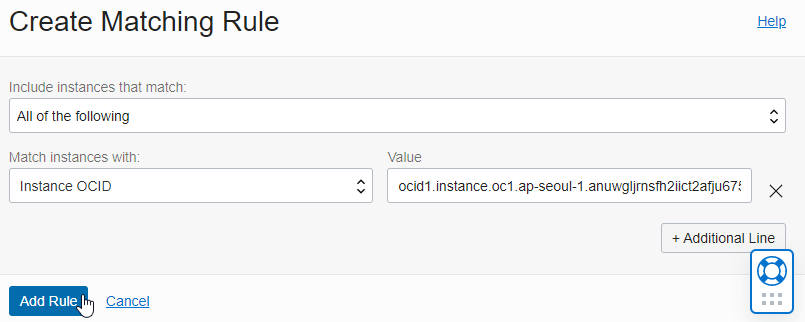
Click Rule Builder on the right side of the rule creation section to add a rule through the tool.
- Matching criteria: Instance OCID
- VALUE: OCID of the copied Compute instance
-
Enter NAME and DESCRIPTION to create a Dynamic Group.
- Name: Ex) MyInstancePrincipleDynamicGroup
Policy settings
-
Go to Identity & Security > Identity > Policies.
-
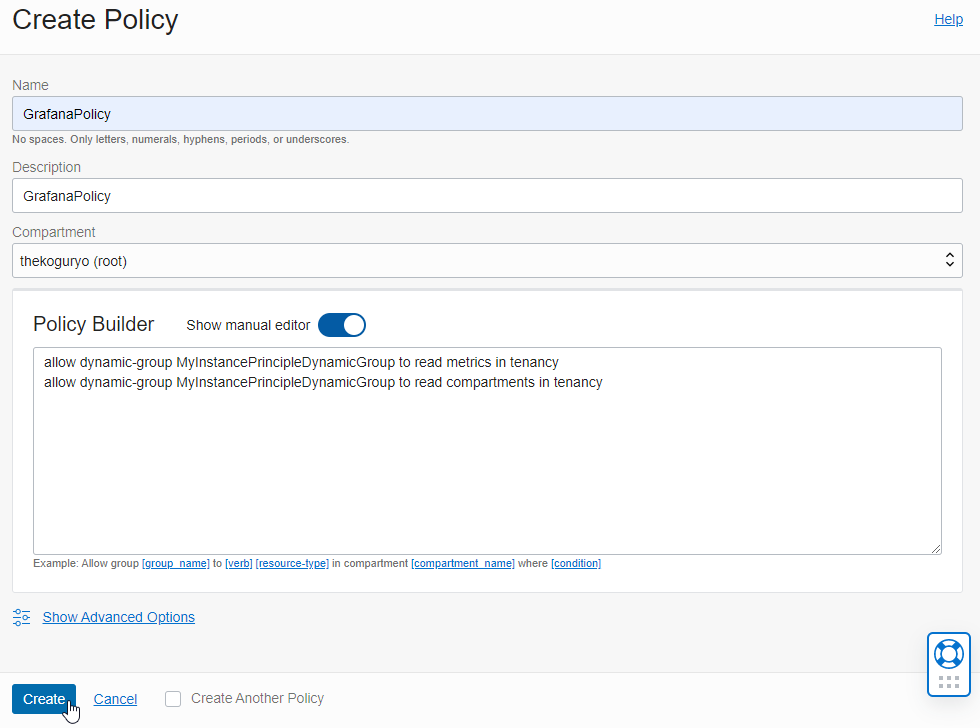
Click Create Policy.
-
Create a policy with the following two permissions.
allow dynamic-group <dynamic group you created> to read metrics in tenancy allow dynamic-group <created dynamic group> to read compartments in tenancy -
Policy creation screen
Check OCI CLI connection
-
Connect to the Compute instance created earlier with SSH.
-
Connect with the Instance Principal method with the following command. You can check the connection even though the OCI CLI config file is not set.
oci os ns get --auth instance_principal-
Connection example
[opc@mygrafana ~]$ oci os ns get --auth instance_principal
{
  "data": "thekoguryo"
}
[opc@mygrafana ~]$
-
Install Grafana
-
Connect to the Compute instance and install Grafana by executing the following commands in order.
- Reference: https://grafana.com/grafana/download?edition=oss
- As of January 2022, after installing 8.3.3 and 8.2.7, a connection error occurred, so 8.1.8 was installed.
wget https://dl.grafana.com/oss/release/grafana-8.1.8-1.x86_64.rpm sudo yum install -y grafana-8.1.8-1.x86_64.rpm sudo systemctl start grafana-server sudo grafana-cli plugins install oci-metrics-datasource sudo firewall-cmd --permanent --add-port=3000/tcp sudo firewall-cmd --reload sudo systemctl restart grafana-server-
Execution example
[opc@grafana ~]$ wget https://dl.grafana.com/oss/release/grafana-8.1.8-1.x86_64.rpm
--2022-01-17 04:40:23--  https://dl.grafana.com/oss/release/grafana-8.1.8-1.x86_64.rpm
Resolving dl.grafana.com (dl.grafana.com)... 151.101.54.217, 2a04:4e42:d::729
Connecting to dl.grafana.com (dl.grafana.com)|151.101.54.217|:443... connected.
HTTP request sent, awaiting response... 200 OK
Length: 56048174 (53M) [application/x-redhat-package-manager]
Saving to: ‘grafana-8.1.8-1.x86_64.rpm’

grafana-8.1.8-1.x86_64.rpm             100%[===========================================================================>]  53.45M  15.9MB/s    in 4.2s

2022-01-17 04:40:28 (12.6 MB/s) - ‘grafana-8.1.8-1.x86_64.rpm’ saved [56048174/56048174]

[opc@grafana ~]$ sudo yum install grafana-8.1.8-1.x86_64.rpm
Last metadata expiration check: 0:02:06 ago on Mon Jan 17 04:38:24 2022.
Dependencies resolved.
=========================================================================================================================
 Package                  Architecture            Version                  Repository                     Size
=========================================================================================================================
Installing:
 grafana                  x86_64                  8.1.8-1                  @commandline                   53 M

Transaction Summary
=========================================================================================================================
Install  1 Package

Total size: 53 M
Installed size: 178 M
Downloading Packages:
Running transaction check
Transaction check succeeded.
Running transaction test
Transaction test succeeded.
Running transaction
  Preparing        :                                                                                                                                   1/1
  Installing       : grafana-8.1.8-1.x86_64                                                                                                            1/1
  Running scriptlet: grafana-8.1.8-1.x86_64                                                                                                            1/1
### NOT starting on installation, please execute the following statements to configure grafana to start automatically using systemd
 sudo /bin/systemctl daemon-reload
 sudo /bin/systemctl enable grafana-server.service
### You can start grafana-server by executing
 sudo /bin/systemctl start grafana-server.service

POSTTRANS: Running script

  Verifying        : grafana-8.1.8-1.x86_64                                                                                                            1/1

Installed:
  grafana-8.1.8-1.x86_64

Complete!
[opc@grafana ~]$ sudo systemctl start grafana-server
[opc@grafana ~]$ sudo grafana-cli plugins install oci-metrics-datasource
✔ Downloaded oci-metrics-datasource v3.0.0 zip successfully

Please restart Grafana after installing plugins. Refer to Grafana documentation for instructions if necessary.

[opc@grafana ~]$ sudo firewall-cmd --permanent --add-port=3000/tcp
success
[opc@grafana ~]$ sudo firewall-cmd --reload
success
[opc@grafana ~]$ sudo systemctl restart grafana-server
[opc@grafana ~]$
-
Open port 3000 to Ingress of the Security List of the VM where Grafana is installed.
-
Grafana Login
Connect to the Compute instance where Grafana is installed through port 3000. The default access account is admin/admin.
참고 사이트
- https://grafana.com/blog/2019/02/25/oracle-cloud-infrastructure-as-a-data-source-for-grafana/
- https://blogs.oracle.com/cloudnative/data-source-grafana
- https://grafana.com/grafana/plugins/oci-metrics-datasource/
- https://github.com/oracle/oci-grafana-metrics/blob/master/docs/linux.md
As an individual, this article was written with my personal time. There may be errors in the content of the article, and the opinions in the article are personal opinions.